


Analysis
Three September publications frame an investment problem rather than a single price forecast. The IEA’s grid report estimates up to 330 GW of additional generation, storage and demand connections through better use of existing networks. Its electrification report separates a 23% final-energy electricity share in 2025 from a 33% competitive-potential calculation and a 35% High Electrification Scenario for 2035. The Türkiye review distinguishes 43% renewable generation in 2025 from planned 55% renewable supply in 2035. These scopes cannot be pooled into one deployment forecast.
This analysis uses evidence available by 9 October 2026 and considers procurement and operations in 2026–2027. The news provides dated September context within the August–October window; it does not provide an observed October equipment-price series. Every price, cost allocation and performance parameter below is an explicit engineering assumption. Calculations illustrate mechanisms, not country tariffs, supplier offers, calibrated forecasts or investment advice. Nominal USD values omit inflation and currency conversion.
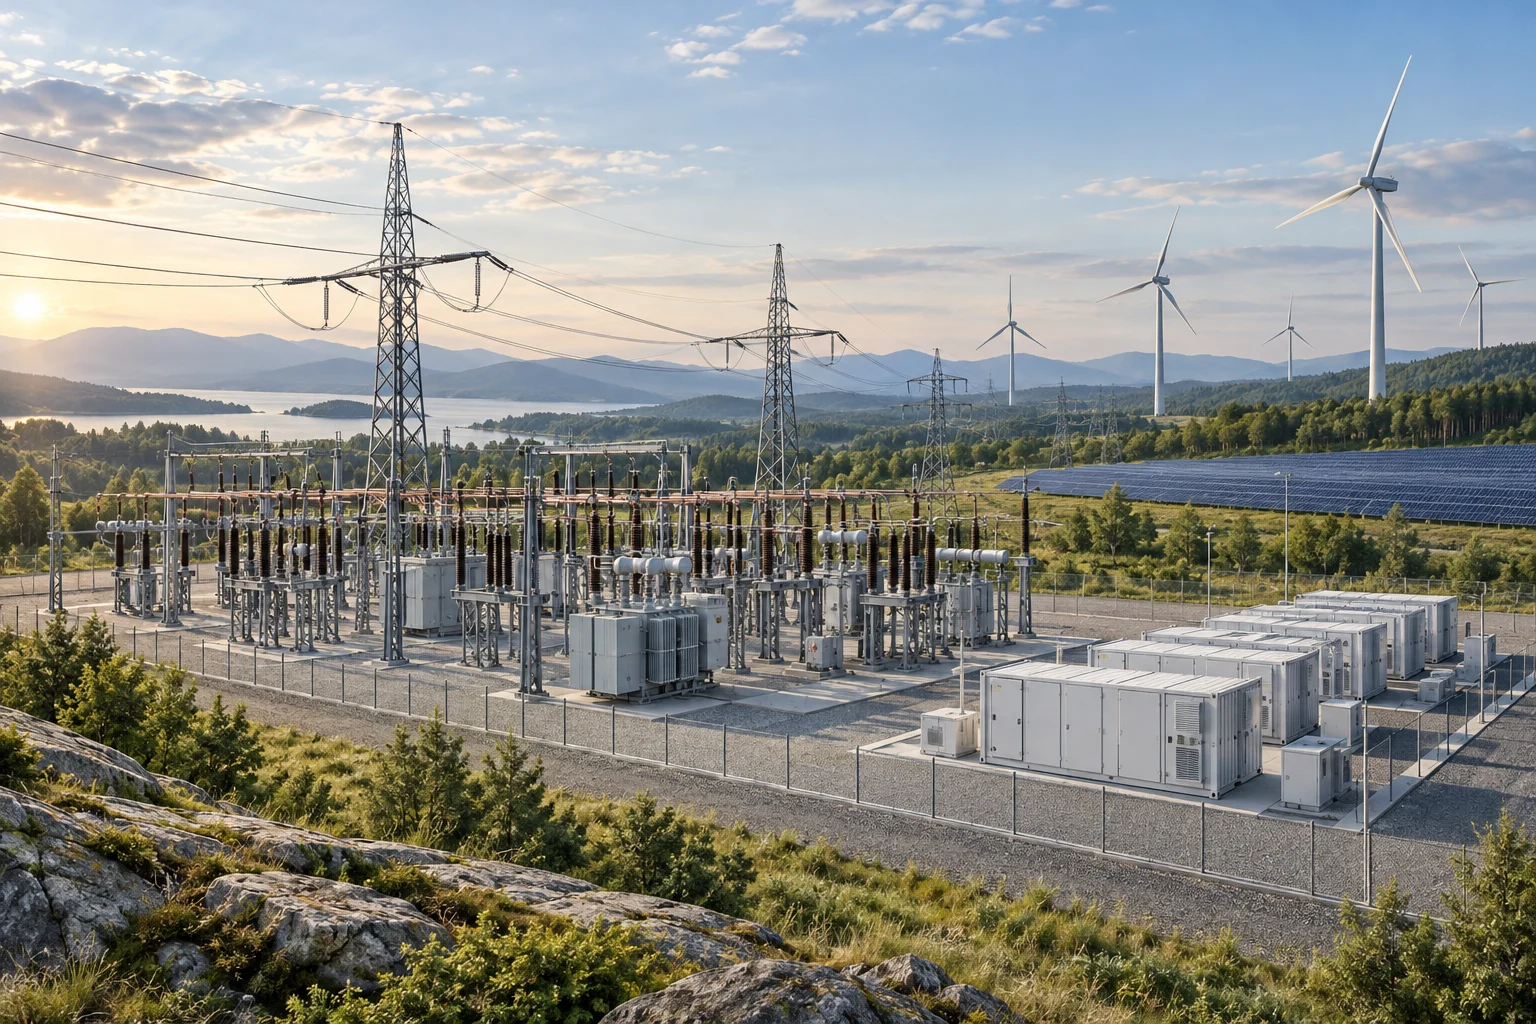
Start with an assumed 100 MW renewable plant, a 25% annual capacity factor and 8,760 hours per year. Gross generation is 100 × 0.25 × 8,760 = 219,000 MWh/year. Assume 10% of this output is curtailed at the connection; delivered output becomes 197,100 MWh/year. Curtailment is applied after the stated gross capacity factor to avoid counting it twice. The assumed plant is not a named Turkish installation, and average annual output says nothing about firm peak capacity.
Now assume USD 100 million of installed capital and annual capital recovery equal to 10% of that initial sum. This simplified annual charge is USD 10 million, rather than a fully specified financing model. Dividing by gross energy gives USD 45.66/MWh; dividing by delivered energy gives USD 50.74/MWh. The same equipment has a higher unit cost solely because fewer saleable megawatt-hours cross the connection. Operations, tax, balancing, grid fees and the residual asset value are excluded. Actual recovery requires financing tenor, discount rate and debt structure.
For a transparent raw-material sensitivity, assume conductors and cables represent USD 20 million of the budget, of which 60% is exposed to a copper-price component. A hypothetical 25% rise in that component adds 20 × 0.60 × 0.25 = USD 3 million. It does not raise the entire cable invoice by 25%. Separately assume freight accounts for USD 5 million, with a 40% increase adding USD 2 million. These mutually exclusive baseline allocations produce USD 105 million total capital. At the same 10% recovery and 197,100 MWh delivery, the capital component becomes USD 53.27/MWh. Fixed-price contracts or hedges can change pass-through.
Grid improvements create value only when recovered energy coincides with usable transfer capacity. If the same plant’s curtailment falls hypothetically from 10% to 5%, delivery increases by 10,950 MWh/year. At an assumed realised price of USD 60/MWh, that adds USD 657,000 annual gross receipts before extra costs. This is not an estimate of digital-tool effectiveness. Dynamic ratings can fall during hot, still conditions; transformer and stability constraints may remain. A signed connection agreement must establish whether access is firm, conditional or interruptible before the receipts become bankable.
Storage has another denominator. Assume 100 MW and 200 MWh of usable discharge energy, 250 full cycles annually and 85% round-trip efficiency measured at the same connection boundary. Annual discharge is 50,000 MWh and charging requires about 58,823.53 MWh. At assumed charging and selling prices of USD 50/MWh and USD 100/MWh, respectively, energy-only margin is USD 41.18 per discharged MWh, or roughly USD 2.06 million/year. This excludes degradation, maintenance, capital recovery and ancillary-service commitments. It is not profit. Counting avoided curtailment and arbitrage on the same energy twice would overstate value.
Useful heat must likewise be compared after conversion. The companion electrification news assumes electricity at USD 120/MWh, gas at USD 45/MWh, heat-pump seasonal performance of 3 and boiler efficiency of 90%. Heat costs USD 40/MWh versus USD 50/MWh before ownership costs. At performance of 2, the heat-pump figure rises to USD 60/MWh. The cost ranking therefore depends on delivered service and season, not just the energy-carrier quotation.
Finally, a hypothetical six-month delay with all USD 100 million already committed and an 8% simple annual carrying rate adds USD 4 million of financing exposure. Actual drawdown schedules can make that assumption excessive, while lost revenue adds a separate effect. Procurement decisions need dated copper-index clauses, shipping terms, exchange-rate exposure, usable battery guarantees, hourly constraints and debt schedules. September’s reports support coordinated generation, grid and flexibility planning; the decisive economic test is a consistent boundary from paid equipment through connected capacity to useful delivered energy.