


Analysis
A refinery's crude-processing rate, a heater's thermal duty and a site's energy intensity describe different quantities. A figure in barrels per day cannot reveal furnace efficiency, while a megawatt rating does not identify how much crude a plant can distil. Useful comparisons start by identifying the equipment, stream, time interval and energy basis behind each number.
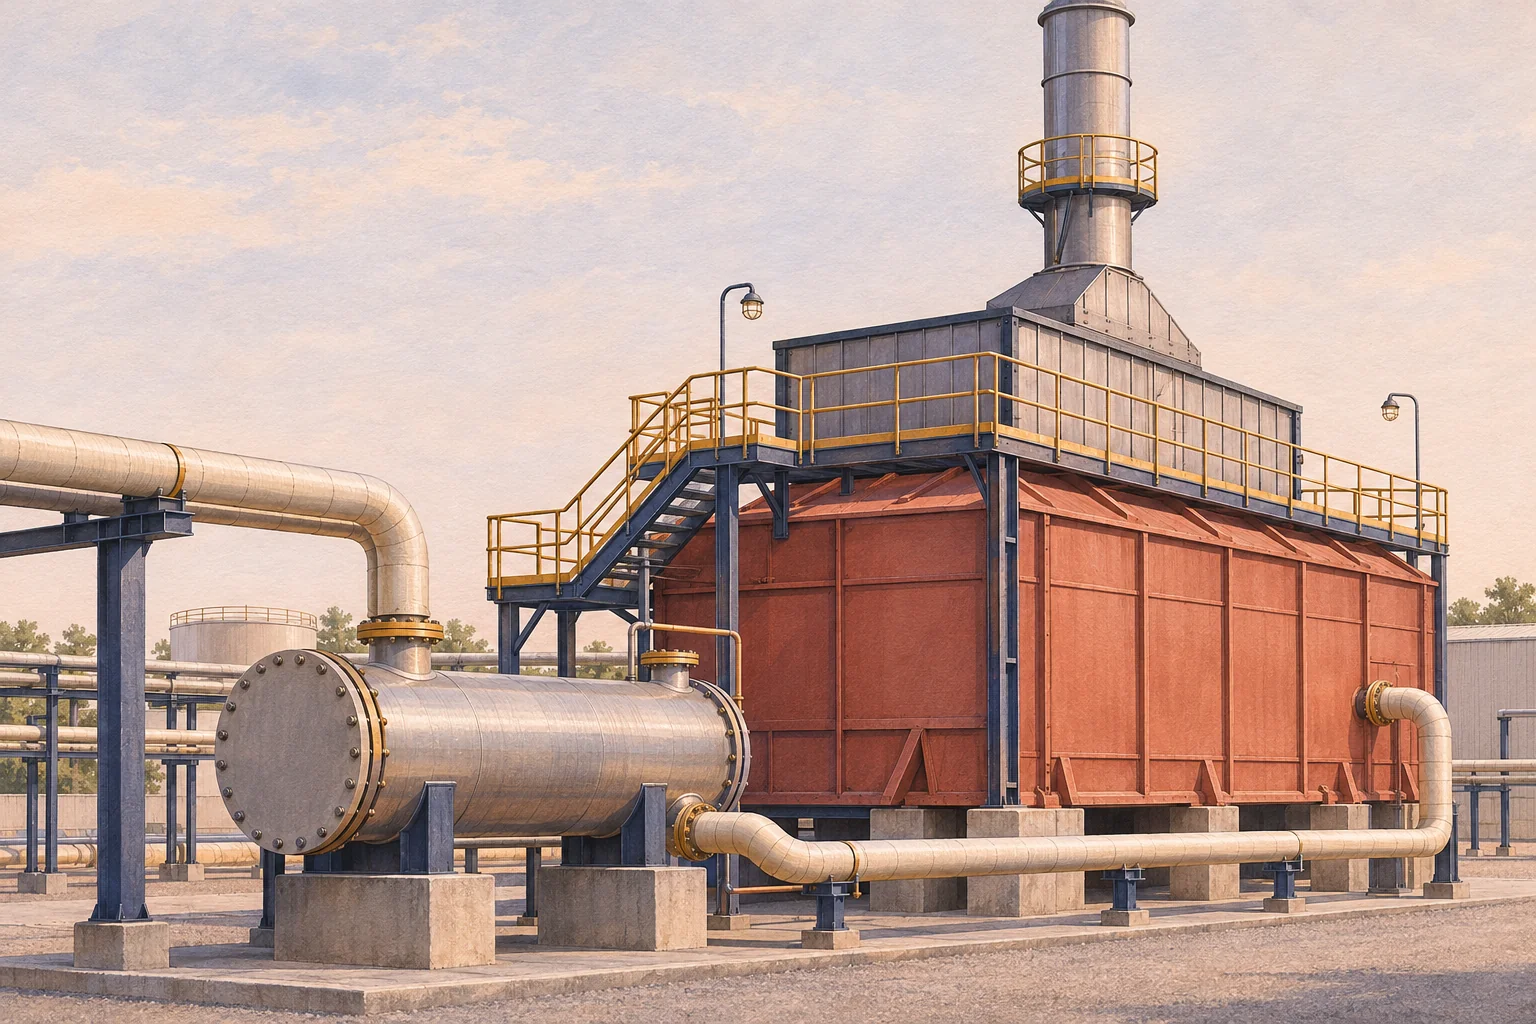
This guide combines foundational DOE thermodynamics and process-heating references with dated CONUEE and EPA documents. Its numerical example is entirely hypothetical: no actual refinery's heat capacity, efficiency, fuel use or operating availability is inferred. The chart is calculated from declared inputs. The accompanying conceptual illustration is not an authentic facility photograph or an engineering design.
Define the physical boundary
For one heater, distinguish the process stream receiving heat from the fuel supplying chemical energy. State whether combustion-air preheating and heat recovery are inside the boundary. Pump and fan electricity, imported steam and exported heat need their own treatment; an undefined mixture of these flows is not a reproducible efficiency measure.
A whole-refinery balance has a broader boundary, potentially including refinery fuel gas, purchased energy and utility transfers. Internal streams should not be counted repeatedly as new external inputs. Keep production, intermediate circulation and energy supply separate. An air-permit boundary may group equipment for regulatory purposes without defining the boundary of your thermal calculation.
Calculate useful heat with consistent units
For a steady-flow heater with negligible shaft work and kinetic or potential energy changes, useful duty is Q̇ = ṁ(h_out − h_in). For single-phase sensible heating at approximately constant pressure, with constant specific heat, this simplifies to Q̇ = ṁ c_p ΔT. A phase change requires an enthalpy calculation including latent heat; temperature difference alone is insufficient.
Assume a liquid flow of 100,000 kg/h, c_p = 2.2 kJ/(kg·K) and ΔT = 50 K. Assume the stream remains liquid, with no reaction or accumulation. Then Q̇ = 100,000 × 2.2 × 50 = 11,000,000 kJ/h = 11 GJ/h = 3.055556 MW. The specific heat is a prescribed example input, not a measured crude property. One MW equals 3.6 GJ/h; power and accumulated energy are different quantities.
Separate useful duty from fuel input
Define η = Q̇_useful/Ḟ_fuel, using the same heating-value convention throughout. All efficiencies here are assumed on one lower-heating-value basis. At η = 0.80, fuel input is 11/0.80 = 13.75 GJ/h, or 3.819444 MW. Useful heat remains 11 GJ/h; the difference is 2.75 GJ/h within this simplified boundary.
That difference is not an independently measured stack loss. A real assessment must distinguish flue-gas, casing and other losses rather than assigning invented percentages. Nor does the calculation establish burner geometry, fuel composition, flame conditions, oxygen concentration or safe control settings. Electrical auxiliaries remain outside this particular fuel-to-process-heat ratio.
Compare efficiencies at a fixed duty
Holding useful duty at 11 GJ/h, assumed efficiencies of 70%, 80% and 90% require 15.714286, 13.75 and 12.222222 GJ/h of fuel respectively. The accessible chart shows these calculated rates. Feed flow and temperature rise are held constant; the comparison neither predicts higher production nor supplies measured performance for Salina Cruz or Commerce City.
Moving from 70% to 90% is a 20-percentage-point efficiency increase. Relative fuel reduction is 1 − 0.70/0.90 = 22.222222%, not 20%. Using unrounded values, the difference is 3.492063 GJ/h. If both cases operated for an assumed 8,000 h, the annual difference would be 27,936.507937 GJ. Those hours are an assumption, not plant availability.
Normalize intensity without changing the denominator
The example processes 100 t/h. At 80% assumed efficiency, fuel intensity is 13.75/100 = 0.1375 GJ/t of feed; useful-heat intensity is 11/100 = 0.11 GJ/t. These two indicators answer different questions. Neither is a whole-refinery benchmark, a product carbon intensity or a published industry average.
A per-barrel comparison also requires liquid density and a declared volume reference condition. Do not substitute finished-product barrels for crude-feed tonnes or mix calendar-day and stream-day denominators. Startup, shutdown, changes in feed composition and utilization can change site intensity even when individual equipment efficiency is unchanged. Preserve the reporting period and measurement scope.
Read the Salina Cruz audit on its own terms
CONUEE's 6 June 2024 report describes a 14–17 May 2024 energy-management follow-up at Salina Cruz, Oaxaca. Auditors visited the primary and vacuum plants, catalytic plant, hydro-reformer and main services. The account discusses operating windows, boiler maintenance and fired-heater burners. It provides firsthand evidence of the named site's refining and energy-management activities.
The audit's installed crude-capacity description is separate from heater duty. Its energy-management maturity finding is not a measured thermal efficiency or proof that a particular retrofit has been commissioned. The directly linked Atlas record preserves unknown current capacity and operating status. None of this guide's hypothetical flow, temperature rise or efficiency is assigned to that refinery.
Distinguish Commerce City plants from permit boundaries
EPA's 30 December 2024 order describes Commerce City's Plants 1 and 3 as an integrated petroleum refinery and identifies the separately permitted East Plant 2 within one major air-emission source. The July 2023 East Plant order addresses crude and vacuum heaters. These documents identify process and permit scopes; separate permits do not create additive crude-processing capacities.
An emission limit or fuel-based emissions calculation is not a measurement of heat delivered to the process. The Atlas record therefore keeps capacity and current operating state unknown despite corroborated refinery identity. The research link does not create an EIA capacity join, certify permit compliance or establish a physical supply chain to a well.
Build a reproducible measurement package
A site calculation needs synchronized process-flow, inlet/outlet temperature and pressure measurements, an appropriate enthalpy or property model, fuel-flow measurements and fuel heating value. Record calibration, sampling intervals, instrument uncertainty and whether values are gross or net. Missing fuel composition, density or heat-capacity data should remain unknown rather than being filled with convenient defaults.
For vaporizing or reacting streams, include the relevant phase and reaction enthalpies. For transient operation, retain accumulation and the actual integration period. Compare calculated duty against an independently measured energy balance where possible. The present steady-state example demonstrates arithmetic only; it is not a validated simulator or a trained predictive model.
Evaluate improvement opportunities within operating limits
DOE's process-heating sourcebook examines heat recovery, air leakage, heat-transfer surfaces and combustion losses as parts of a system. A change to one component can affect draft, pressure drop, fouling, reliability and other energy demands. A screening ratio cannot establish a safe burner adjustment or replace equipment-specific engineering and operating procedures.
Economic evaluation also needs verified tariffs, capital cost, maintenance consequences and a defensible operating schedule. The hypothetical annual energy difference is not a project saving or payback forecast. Read it alongside the capacity, density, mass-balance and permit-status guides, keeping observed site evidence separate from assumed engineering inputs.