


Analysis
A production rate becomes useful engineering evidence only when its pressure, fluid, time and measurement basis are known. A large daily rate alone cannot establish reservoir quality, sustainable deliverability or the benefit of a workover. The first task is to identify what was measured and where, before fitting a performance relationship.
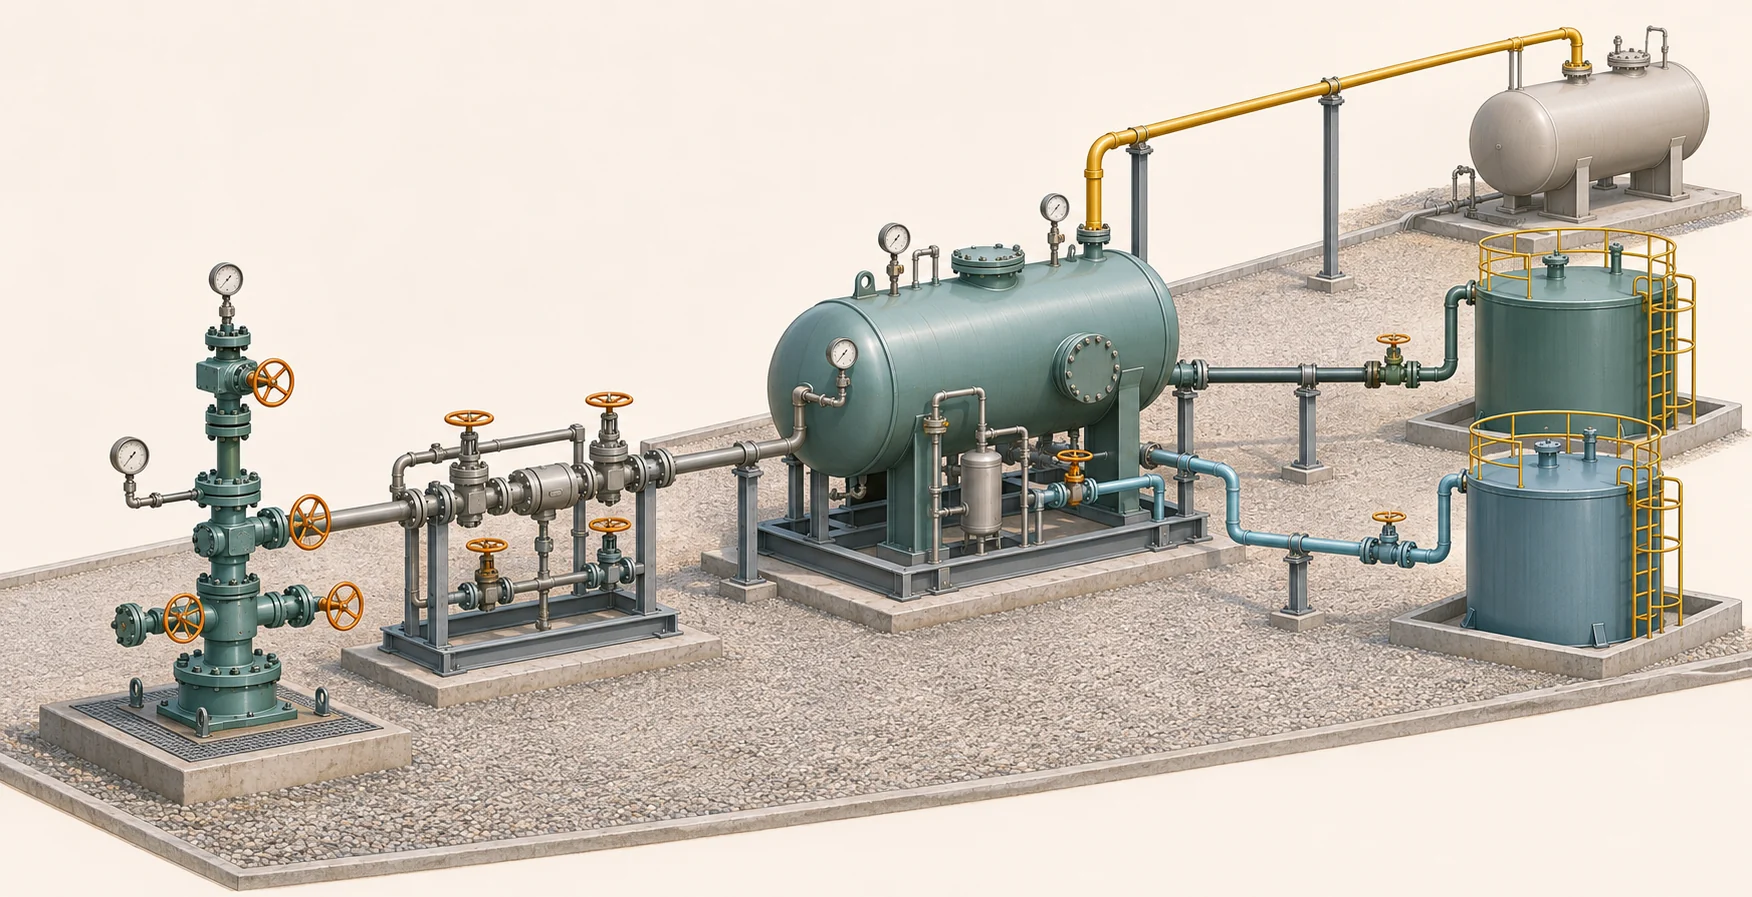
This guide separates source definitions, a deliberately hypothetical calculation and a real research pathway. Every number in the worked example is prescribed for teaching. None is a measurement, forecast or operating limit for the linked SODIR wellbore. The illustration is AI-generated conceptual artwork of a fictional surface installation, not a test schematic or project photograph.
Define drawdown at a common pressure datum
SLB defines production-test drawdown as the difference between average reservoir pressure and flowing bottomhole pressure. Write Δp = p̄r − pwf. Both pressures must refer to a compatible reservoir depth and pressure reference; use absolute pressure consistently here. A wellhead pressure cannot simply replace sandface pressure. Wellbore fluid head and flowing friction separate those measurement locations.
Record gauge depth, datum, calibration, timestamp and whether a quoted pressure is measured or calculated. Measured depth follows the borehole, whereas true vertical depth controls a simple hydrostatic head. The linked depth and drilling-pressure guides explain these distinctions. A static drilling-fluid pressure calculation does not supply flowing reservoir pressure or a production-test interpretation.
State the productivity definition and the phase assumptions
The productivity index J expresses a compatible production rate per unit drawdown: J = q/Δp. For the present example q means stock-tank oil rate in STB/day, so J has units STB/day/psi. Retain the declared surface reference conditions. Reservoir barrels, total liquid, oil and gas-equivalent rates cannot silently share that numerator.
A constant-J relation q = J(p̄r − pwf) is assumed only over the example pressure range for single-phase liquid inflow, with effectively unchanged fluid properties and test conditions. It is not a universal oil-well law. SLB describes an inflow performance relationship as rate versus flowing bottomhole pressure and explains that fluid composition and phase behaviour affect its shape. Gas evolution or multiphase flow requires an appropriate model and supporting fluid data.
Reproduce the fictional reference point
Prescribe p̄r = 4,000 psia, pwf = 3,000 psia and q = 500 STB/day. The drawdown is 1,000 psi, and J = 500/1000 = 0.5 STB/day/psi. For this teaching exercise also assume a bubblepoint of 2,000 psia and single-phase inflow throughout the evaluated pressure range. These are assumptions, not laboratory PVT results.
Hold reservoir pressure and J fixed. At pwf = 3,500, 3,000 and 2,500 psia, the corresponding drawdowns are 500, 1,000 and 1,500 psi. Multiplication by 0.5 gives 250, 500 and 750 STB/day. The accompanying chart and table contain exactly these calculated scenarios. They are not three observed test points or evidence that any real well can reach the largest rate.
Bound the arithmetic uncertainty honestly
Now prescribe independent bounds for the reference point: oil rate 500 ± 25 STB/day, reservoir pressure 4,000 ± 50 psia and flowing pressure 3,000 ± 50 psia. The extreme compatible drawdowns are 900 and 1,100 psi. Combining the lowest rate with the largest drawdown gives Jmin = 475/1100 = 0.431818; combining the highest rate with the smallest drawdown gives Jmax = 525/900 = 0.583333 STB/day/psi.
This is a worst-case interval under the stated bounds, not a confidence interval, probability distribution or instrument specification. Correlated pressure errors, changing fluid properties and model error are not quantified. The interval describes arithmetic sensitivity at the reference point; it does not validate the constant-J assumption or quantify future production uncertainty.
Treat a test as a pressure-and-rate history
SLB distinguishes drawdown, buildup, injection and interference tests, and describes pressure-transient analysis using pressure, rate and time. A pressure recorded shortly after shut-in is not automatically a representative average reservoir pressure. Interpretation needs the preceding rate history, test duration, gauge location and an assessment of the flow regime.
A practical review should retain the unedited time series, rate changes, shut-in events, separator conditions, water and gas measurements, calibration records and quality flags. Align clocks before combining pressure and flow. Distinguish a stabilized test rate from an initial peak, an allocation estimate and a monthly average. Without those distinctions, dividing two reported numbers may produce a precise-looking index with no defensible physical meaning.
Do not diagnose skin or select artificial lift from one ratio
Skin is a dimensionless representation of impaired or enhanced near-well performance relative to a theoretical reference. A lower apparent J can also accompany different reservoir pressure, fluid state, completion conditions or an inconsistent measurement basis. One rate-pressure pair cannot independently determine permeability, skin and reservoir boundaries. Those quantities require a suitable interpretation with additional evidence.
Likewise, an inflow curve alone does not select a pump, choke or safe production rate. The surface operating point also depends on wellbore and facility pressure requirements, fluid behaviour and equipment constraints. This article supplies no tubing-performance model, sand-control criterion, drawdown limit or intervention recommendation. The fictional 750 STB/day scenario is a multiplication result, not a field instruction.
Follow a real record without borrowing its identity
The cited Well Atlas entry no-sodir-112 identifies SODIR source record 112, wellbore 16/11-1 S. Its source page and the existing research interface provide an explicit route to retained documents and test summaries. Inspect each test’s own dates, units and depth references. The presence of a test summary or a shared well name does not establish that it contains the complete, compatible inputs needed for this worked example.
No pressure or rate from that well was used to calculate the chart. Its registry identity is not a verified physical join to another catalogue, a producing-field allocation or a refinery supply relationship. Keep missing inputs unknown. Use the related production-data guide when moving from test rates to calendar-period observations; those are different reporting products with different denominators.
Keep a reproducible evidence package
A reviewable productivity estimate should travel with its exact source record, fluid and rate basis, common pressure datum, observation period, calculation, assumptions and limitations. Preserve the original values beside any conversion. Store a calculated index separately from measured pressure and rate, and label fitted or forecast output explicitly. A later source review date does not make old measurements newly observed.
The example can be independently reproduced with division, subtraction and multiplication; no fitted reservoir model or accuracy claim is involved. For an actual study, obtain the missing test history and fluid information before interpreting a curve. This preserves a useful connection between educational petroleum engineering and real records without manufacturing reservoir properties or operational certainty.